FAQ 3.3 Has there been a Change in Extreme Events like Heat Waves, Droughts, Floods and Hurricanes?
Frequently Asked Question 3.3
Has there been a Change in Extreme Events like Heat Waves, Droughts, Floods and Hurricanes?
Since 1950, the number of heat waves has increased and widespread increases have occurred in the numbers of warm nights. The extent of regions affected by droughts has also increased as precipitation over land has marginally decreased while evaporation has increased due to warmer conditions. Generally, numbers of heavy daily precipitation events that lead to flooding have increased, but not everywhere. Tropical storm and hurricane frequencies vary considerably from year to year, but evidence suggests substantial increases in intensity and duration since the 1970s. In the extratropics, variations in tracks and intensity of storms reflect variations in major features of the atmospheric circulation, such as the North Atlantic Oscillation.
In several regions of the world, indications of changes in various types of extreme climate events have been found. The extremes are commonly considered to be the values exceeded 1, 5 and 10% of the time (at one extreme) or 90, 95 and 99% of the time (at the other extreme). The warm nights or hot days (discussed below) are those exceeding the 90th percentile of temperature, while cold nights or days are those falling below the 10th percentile. Heavy precipitation is defined as daily amounts greater than the 95th (or for ‘very heavy’, the 99th) percentile.
In the last 50 years for the land areas sampled, there has been a significant decrease in the annual occurrence of cold nights and a significant increase in the annual occurrence of warm nights (Figure 1). Decreases in the occurrence of cold days and increases in hot days, while widespread, are generally less marked. The distributions of minimum and maximum temperatures have not only shifted to higher values, consistent with overall warming, but the cold extremes have warmed more than the warm extremes over the last 50 years (Figure 1). More warm extremes imply an increased frequency of heat waves. Further supporting indications include the observed trend towards fewer frost days associated with the average warming in most mid-latitude regions.
A prominent indication of a change in extremes is the observed evidence of increases in heavy precipitation events over the mid-latitudes in the last 50 years, even in places where mean precipitation amounts are not increasing (see also FAQ 3.2 ). For very heavy precipitation events, increasing trends are reported as well, but results are available for few areas.
Drought is easier to measure because of its long duration. While there are numerous indices and metrics of drought, many studies use monthly precipitation totals and temperature averages combined into a measure called the Palmer Drought Severity Index (PDSI). The PDSI calculated from the middle of the 20th century shows a large drying trend over many Northern Hemisphere land areas since the mid-1950s, with widespread drying over much of southern Eurasia, northern Africa, Canada and Alaska ( FAQ 3.2 , Figure 1), and an opposite trend in eastern North and South America. In the Southern Hemisphere, land surfaces were wet in the 1970s and relatively dry in the 1960s and 1990s, and there was a drying trend from 1974 to 1998. Longer-duration records for Europe for the whole of the 20th century indicate few significant trends. Decreases in precipitation over land since the 1950s are the likely main cause for the drying trends, although large surface warming during the last two to three decades has also likely contributed to the drying. One study shows that very dry land areas across the globe (defined as areas with a PDSI of less than –3.0) have more than doubled in extent since the 1970s, associated with an initial precipitation decrease over land related to the El Niño-Southern Oscillation and with subsequent increases primarily due to surface warming.
Changes in tropical storm and hurricane frequency and intensity are masked by large natural variability. The El Niño- Southern Oscillation greatly affects the location and activity of tropical storms around the world. Globally, estimates of the potential destructiveness of hurricanes show a substantial upward trend since the mid-1970s, with a trend towards longer storm duration and greater storm intensity, and the activity is strongly correlated with tropical sea surface temperature. These relationships have been reinforced by findings of a large increase in numbers and proportion of strong hurricanes globally since 1970 even as total numbers of cyclones and cyclone days decreased slightly in most basins. Specifically, the number of category 4 and 5 hurricanes increased by about 75% since 1970. The largest increases were in the North Pacific, Indian and Southwest Pacific Oceans. However, numbers of hurricanes in the North Atlantic have also been above normal in 9 of the last 11 years, culminating in the record-breaking 2005 season.
Based on a variety of measures at the surface and in the upper troposphere, it is likely that there has been a poleward shift as well as an increase in Northern Hemisphere winter storm track activity over the second half of the 20th century. These changes are part of variations that have occurred related to the North Atlantic Oscillation. Observations from 1979 to the mid-1990s reveal a tendency towards a stronger December to February circumpolar westerly atmospheric circulation throughout the troposphere and lower stratosphere, together with poleward displacements of jet streams and increased storm track activity. Observational evidence for changes in small-scale severe weather phenomena (such as tornadoes, hail and thunderstorms) is mostly local and too scattered to draw general conclusions; increases in many areas arise because of increased public awareness and improved efforts to collect reports of these phenomena.
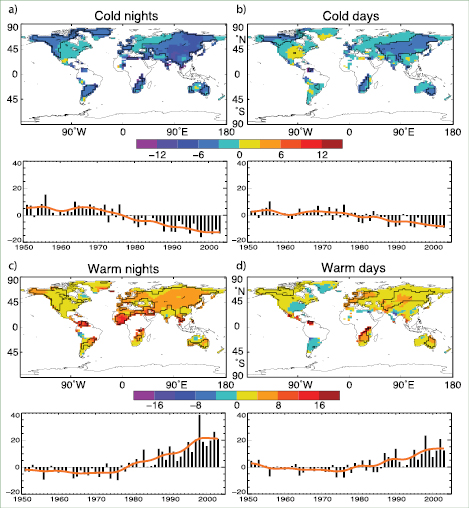
FAQ 3.3, Figure 1. Observed trends (days per decade) for 1951 to 2003 in the frequency of extreme temperatures, defined based on 1961 to 1990 values, as maps for the 10th percentile: (a) cold nights and (b) cold days; and 90th percentile: (c) warm nights and (d) warm days. Trends were calculated only for grid boxes that had at least 40 years of data during this period and had data until at least 1999. Black lines enclose regions where trends are significant at the 5% level. Below each map are the global annual time series of anomalies (with respect to 1961 to 1990). The red line shows decadal variations. Trends are significant at the 5% level for all the global indices shown. Adapted from Alexander et al. (2006).