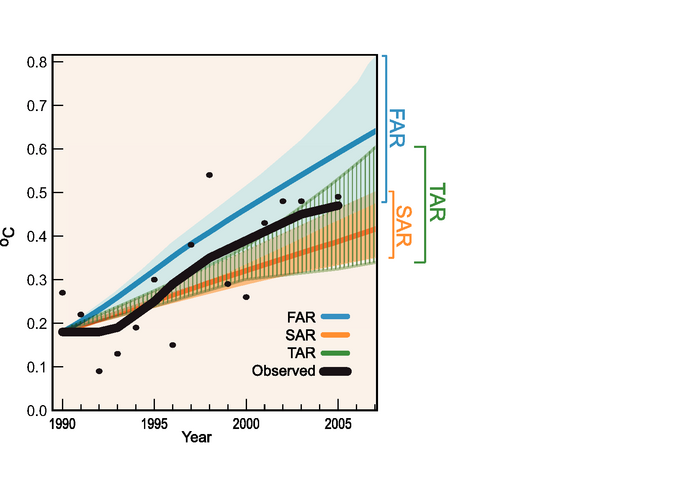
Figure 1.1. Yearly global average surface temperature (Brohan et al., 2006), relative to the mean 1961 to 1990 values, and as projected in the FAR (IPCC, 1990), SAR (IPCC, 1996) and TAR (IPCC, 2001a). The ‘best estimate’ model projections from the FAR and SAR are in solid lines with their range of estimated projections shown by the shaded areas. The TAR did not have ‘best estimate’ model projections but rather a range of projections. Annual mean observations ( Section 3.2 ) are depicted by black circles and the thick black line shows decadal variations obtained by smoothing the time series using a 13-point filter.