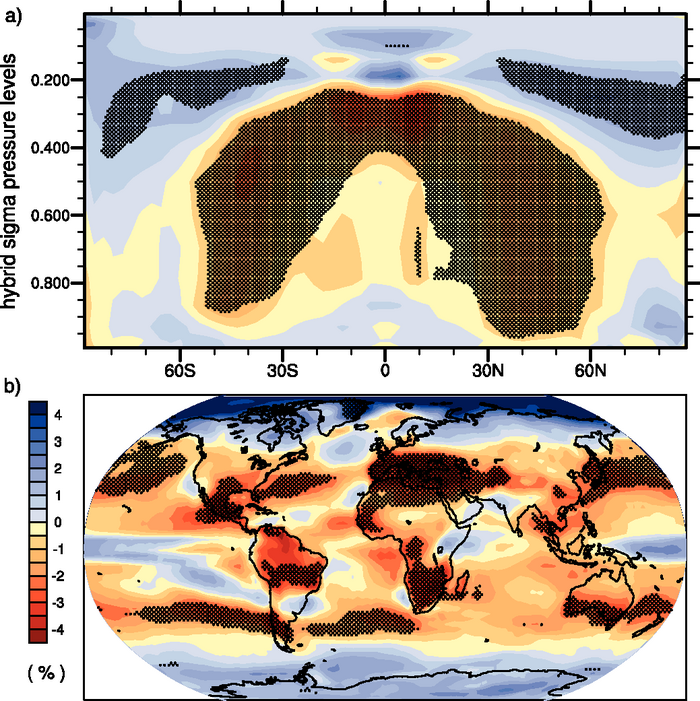
Figure 10.10. Multi-model mean changes in (a) zonal mean cloud fraction (%), shown as a cross section though the atmosphere, and (b) total cloud area fraction (percent cover from all models). Changes are given as annual means for the SRES A1B scenario for the period 2080 to 2099 relative to 1980 to 1999. Stippling denotes areas where the magnitude of the multi-model ensemble mean exceeds the inter-model standard deviation. Results for individual models can be seen in the Supplementary Material for this chapter.