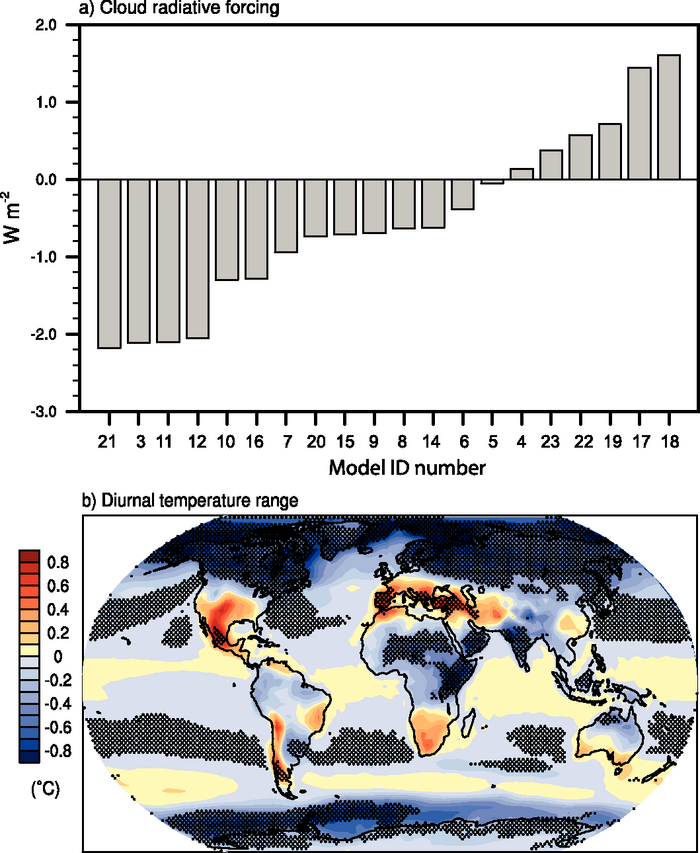
Figure 10.11. Changes in (a) global mean cloud radiative forcing (W m–2) from individual models (see Table 10.4 for the list of models) and (b) multi-model mean diurnal temperature range (°C). Changes are annual means for the SRES A1B scenario for the period 2080 to 2099 relative to 1980 to 1999. Stippling denotes areas where the magnitude of the multi-model ensemble mean exceeds the inter-model standard deviation. Results for individual models can be seen in the Supplementary Material for this chapter.