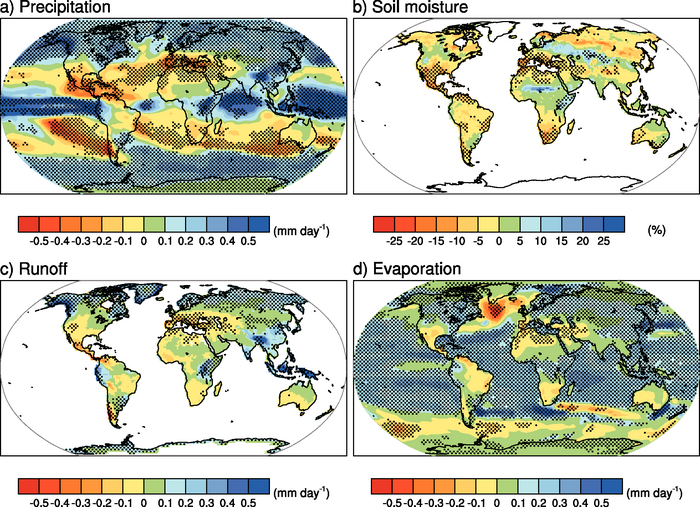
Figure 10.12. Multi-model mean changes in (a) precipitation (mm day–1), (b) soil moisture content (%), (c) runoff (mm day–1) and (d) evaporation (mm day–1). To indicate consistency in the sign of change, regions are stippled where at least 80% of models agree on the sign of the mean change. Changes are annual means for the SRES A1B scenario for the period 2080 to 2099 relative to 1980 to 1999. Soil moisture and runoff changes are shown at land points with valid data from at least 10 models. Details of the method and results for individual models can be found in the Supplementary Material for this chapter.