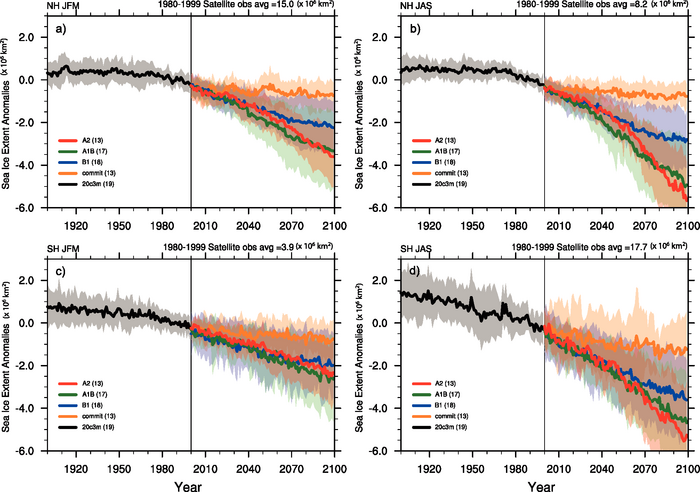
Figure 10.13. Multi-model simulated anomalies in sea ice extent for the 20th century (20c3m) and 21st century using the SRES A2, A1B and B1 as well as the commitment scenario for (a) Northern Hemisphere January to March (JFM), (b) Northern Hemisphere July to September (JAS). Panels (c) and (d) are as for (a) and (b) but for the Southern Hemisphere. The solid lines show the multi-model mean, shaded areas denote ±1 standard deviation. Sea ice extent is defined as the total area where sea ice concentration exceeds 15%. Anomalies are relative to the period 1980 to 2000. The number of models is given in the legend and is different for each scenario.