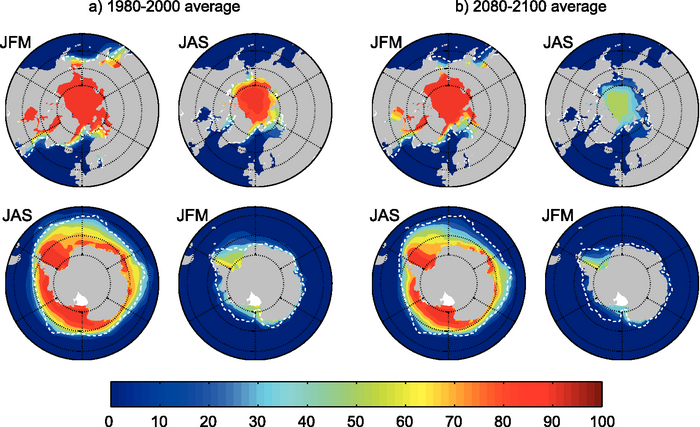
Figure 10.14. Multi-model mean sea ice concentration (%) for January to March (JFM) and June to September (JAS), in the Arctic (top) and Antarctic (bottom) for the periods (a) 1980 to 2000 and b) 2080 to 2100 for the SRES A1B scenario. The dashed white line indicates the present-day 15% average sea ice concentration limit. Modified from Flato et al. (2004).