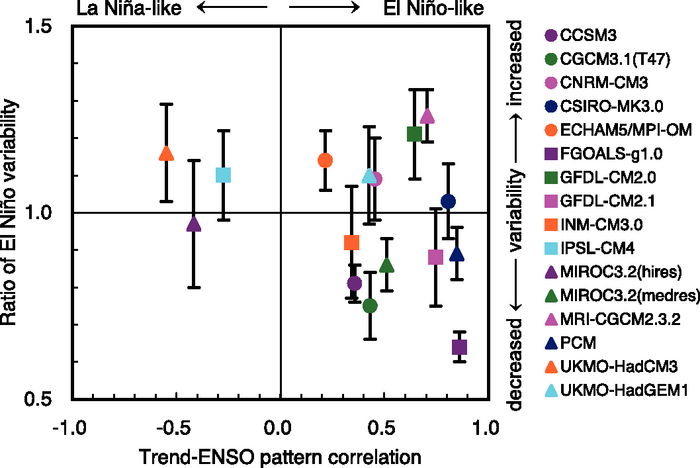
Figure 10.16. Base state change in average tropical Pacific SSTs and change in El Niño variability simulated by AOGCMs (see Table 8.1 for model details). The base state change (horizontal axis) is denoted by the spatial anomaly pattern correlation coefficient between the linear trend of SST in the 1% yr–1 CO2 increase climate change experiment and the first Empirical Orthogonal Function (EOF) of SST in the control experiment over the area 10°S to 10°N, 120°E to 80°W (reproduced from Yamaguchi and Noda, 2006). Positive correlation values indicate that the mean climate change has an El Niño-like pattern, and negative values are La Niña-like. The change in El Niño variability (vertical axis) is denoted by the ratio of the standard deviation of the first EOF of sea level pressure (SLP) between the current climate and the last 50 years of the SRES A2 experiments (2051–2100), except for FGOALS-g1.0 and MIROC3.2(hires), for which the SRES A1B was used, and UKMO-HadGEM1 for which the 1% yr–1 CO2 increase climate change experiment was used, in the region 30°S to 30°N, 30°E to 60°W with a five-month running mean (reproduced from van Oldenborgh et al., 2005). Error bars indicate the 95% confidence interval. Note that tropical Pacific base state climate changes with either El Niño-like or La Niña-like patterns are not permanent El Niño or La Niña events, and all still have ENSO inter- annual variability superimposed on that new average climate state in a future warmer climate.