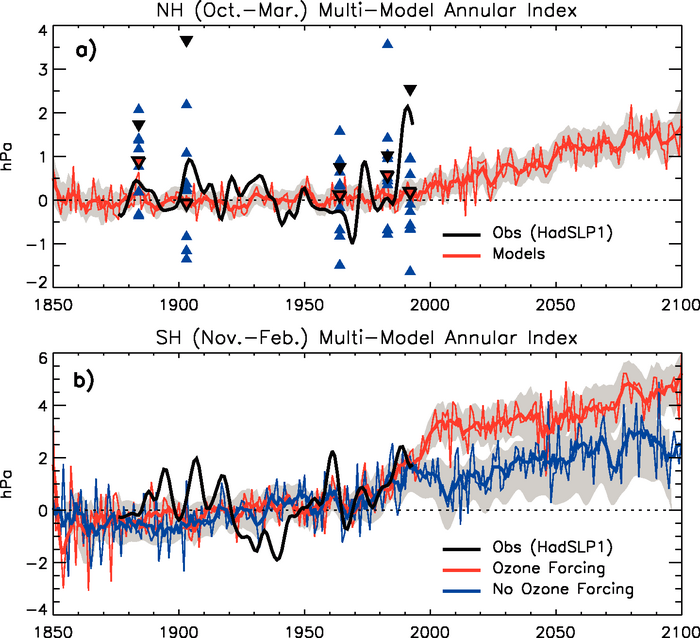
Figure 10.17. (a) Multi-model mean of the regression of the leading EOF of ensemble mean Northern Hemisphere sea level pressure (NH SLP, thin red line). The time series of regression coefficients has zero mean between year 1900 and 1970. The thick red line is a 10-year low-pass filtered version of the mean. The grey shading represents the inter-model spread at the 95% confidence level and is filtered. A filtered version of the observed SLP from the Hadley Centre (HadSLP1) is shown in black. The regression coefficient for the winter following a major tropical eruption is marked by red, blue and black triangles for the multi-model mean, the individual model mean and observations, respectively. (b) As in (a) for Southern Hemisphere SLP for models with (red) and without (blue) ozone forcing. Adapted from Miller et al. (2006).