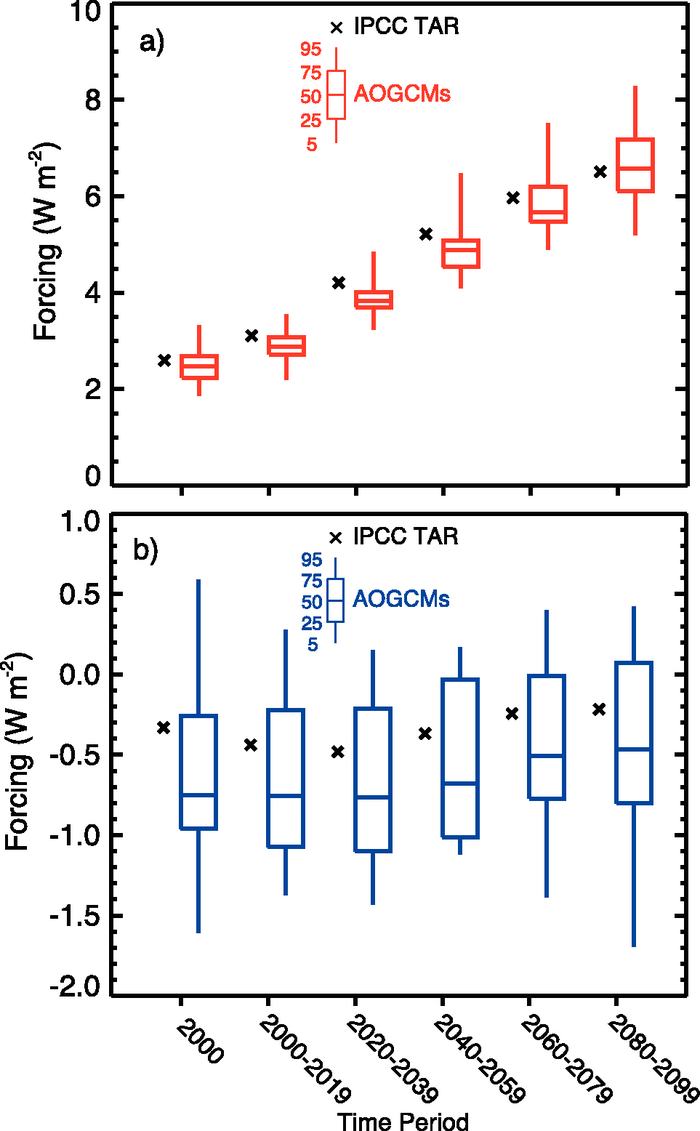
Figure 10.2. Radiative forcings for the period 2000 to 2100 for the SRES A1B scenario diagnosed from AOGCMs and from the TAR (IPCC, 2001) forcing formulas (Forster and Taylor, 2006). (a) Longwave forcing; (b) shortwave forcing. The AOGCM results are plotted with box-and-whisker diagrams representing percentiles of forcings computed from 20 models in the AR4 multi-model ensemble. The central line within each box represents the median value of the model ensemble. The top and bottom of each box shows the 75th and 25th percentiles, and the top and bottom of each whisker displays the 95th and 5th percentile values in the ensemble, respectively. The models included are CCSM3, CGCM3.1 (T47 and T63), CNRM-CM3, CSIRO-MK3, ECHAM5/MPI-OM, ECHO-G, FGOALS-g1.0, GFDL-CM2.0, GFDL-CM2.1, GISS-EH, GISS-ER, INM-CM3.0, IPSL-CM4, MIROC3.2 (medium and high resolution), MRI-CGCM2.3.2, PCM1, UKMO-HadCM3 and UKMO-HadGEM1 (see Table 8.1 for model details).