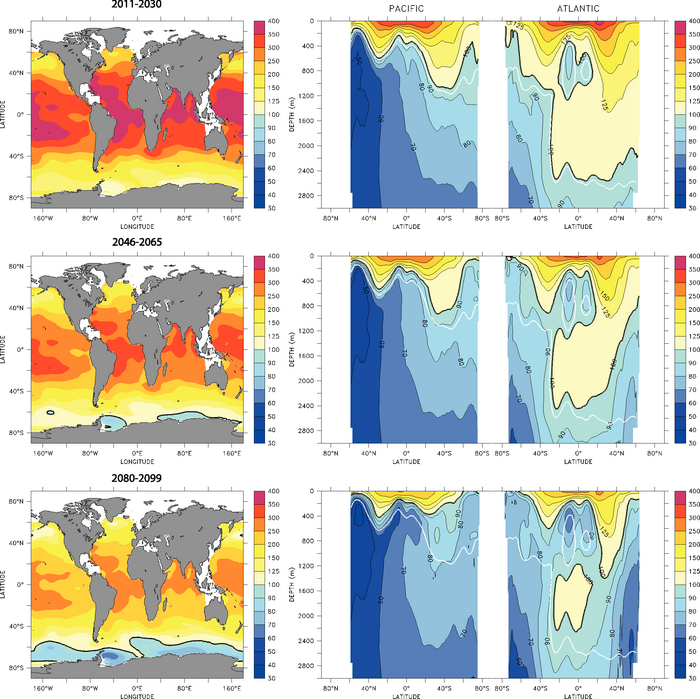
Figure 10.23. Multi-model median for projected levels of saturation (%) with respect to aragonite, a meta-stable form of calcium carbonate, over the 21st century from the Ocean Carbon-Cycle Model Intercomparison Project (OCMIP-2) models (adapted from Orr et al., 2005). Calcium carbonate dissolves at levels below 100%. Surface maps (left) and combined Pacific/Atlantic zonal mean sections (right) are given for scenario IS92a as averages over three time periods: 2011 to 2030 (top), 2045 to 2065 (middle) and 2080 to 2099 (bottom). Atmospheric CO2 concentrations for these three periods average 440, 570 and 730 ppm, respectively. Latitude-depth sections start in the North Pacific (at the left border), extend to the Southern Ocean Pacific section and return through the Southern Ocean Atlantic section to the North Atlantic (right border). At 100%, waters are saturated (solid black line - the aragonite saturation horizon); values larger than 100% indicate super-saturation; values lower than 100% indicate undersaturation. The observation-based (Global Ocean Data Analysis Project; GLODAP) 1994 saturation horizon (solid white line) is also shown to illustrate the projected changes in the saturation horizon compared to the present.