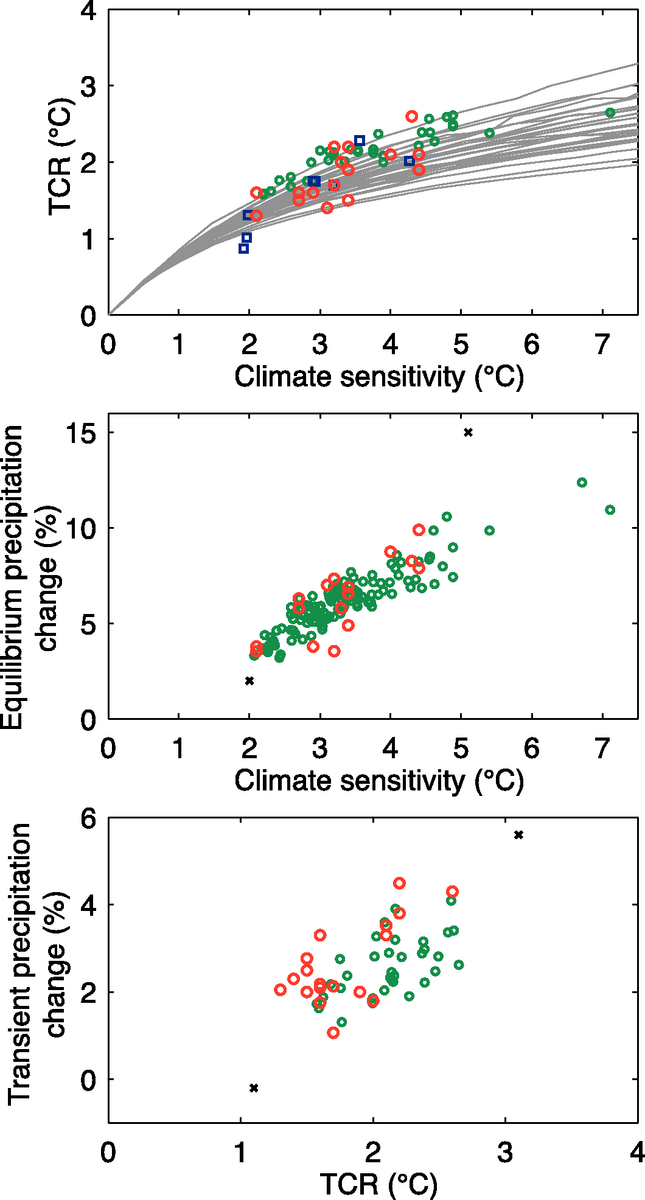
Figure 10.25. (a) TCR versus equilibrium climate sensitivity for all AOGCMs (red), EMICs (blue), a perturbed physics ensemble of the UKMO-HadCM3 AOGCM (green; an updated ensemble based on M. Collins et al., 2006) and from a large ensemble of the Bern2.5D EMIC (Knutti et al., 2005) using different ocean vertical diffusivities and mixing parametrizations (grey lines). (b) Global mean precipitation change (%) as a function of global mean temperature change at equilibrium for doubled CO2 in atmospheric GCMs coupled to a non-dynamic slab ocean (red all AOGCMS, green from a perturbed physics ensemble of the atmosphere-slab ocean version of UKMO-HadCM3 (Webb et al., 2006)). (c) Global mean precipitation change (%) as a function of global mean temperature change (TCR) at the time of CO2 doubling in a transient 1% yr–1 CO2 increase scenario, simulated by coupled AOGCMs (red) and the UKMO-HadCM3 perturbed physics ensemble (green). Black crosses in (b) and (c) mark ranges covered by the TAR AOGCMs (IPCC, 2001) for each quantity.