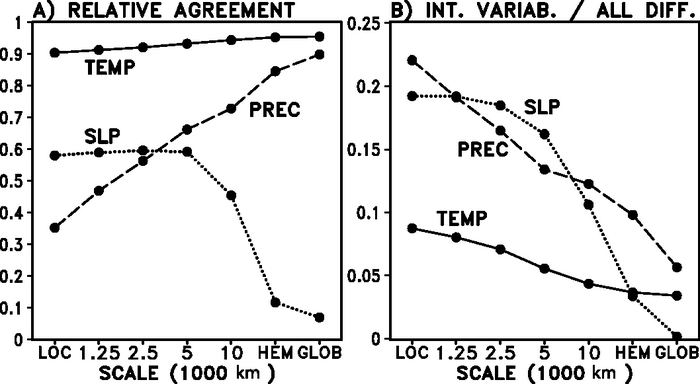
Figure 10.27. Statistics of annual mean responses to the SRES A1B scenario, for 2080 to 2099 relative to 1980 to 1999, calculated from the 21-member AR4 multi-model ensemble using the methodology of Räisänen (2001). Results are expressed as a function of horizontal scale on the x axis (‘Loc’: grid box scale; ‘Hem’: hemispheric scale; ‘Glob’: global mean) plotted against the y axis showing (a) the relative agreement between ensemble members, a dimensionless quantity defined as the square of the ensemble-mean response (corrected to avoid sampling bias) divided by the mean squared response of individual ensemble members, and (b) the dimensionless fraction of internal variability relative to the ensemble variance of responses. Values are shown for surface air temperature, precipitation and sea level pressure. The low agreement of SLP changes at hemispheric and global scales reflects problems with the conservation of total atmospheric mass in some of the models, however, this has no practical significance because SLP changes at these scales are extremely small.