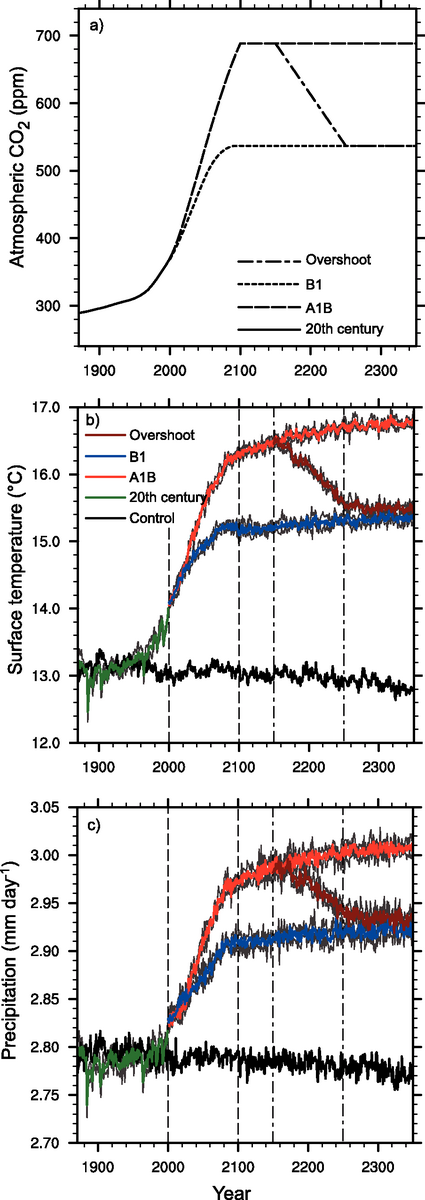
Figure 10.36. (a) Atmospheric CO2 concentrations for several experiments simulated with an AOGCM; (b) globally averaged surface air temperatures for the overshoot scenario and the A1B and B1 experiments; (c) same as in (b) but for globally averaged precipitation rate. Modified from Yoshida et al. (2005).