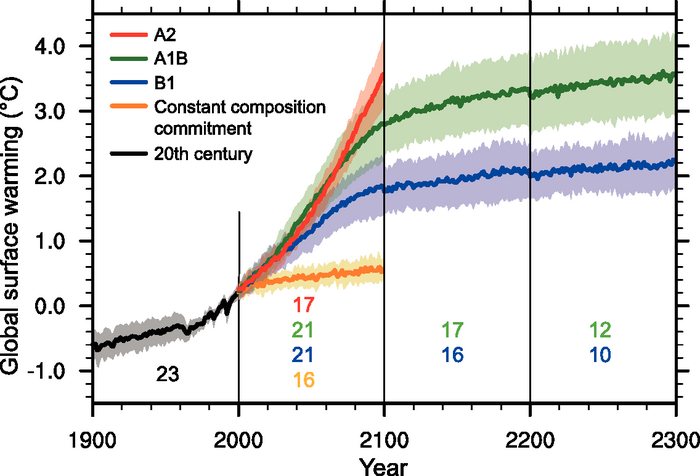
Figure 10.4. Multi-model means of surface warming (relative to 1980–1999) for the scenarios A2, A1B and B1, shown as continuations of the 20th-century simulation. Values beyond 2100 are for the stabilisation scenarios (see Section 10.7 ). Linear trends from the corresponding control runs have been removed from these time series. Lines show the multi-model means, shading denotes the ±1 standard deviation range of individual model annual means. Discontinuities between different periods have no physical meaning and are caused by the fact that the number of models that have run a given scenario is different for each period and scenario, as indicated by the coloured numbers given for each period and scenario at the bottom of the panel. For the same reason, uncertainty across scenarios should not be interpreted from this figure (see Section 10.5.4.6 for uncertainty estimates).