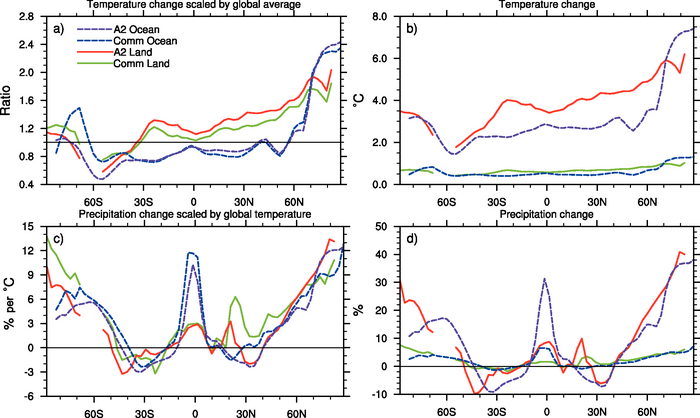
Figure 10.6. Zonal means over land and ocean separately, for annual mean surface warming (a, b) and precipitation (c, d), shown as ratios scaled with the global mean warming (a, c) and not scaled (b, d). Multi-model mean results are shown for two scenarios, A2 and Commitment (see Section 10.7 ), for the period 2080 to 2099 relative to the zonal means for 1980 to 1999. Results for individual models can be seen in the Supplementary Material for this chapter.