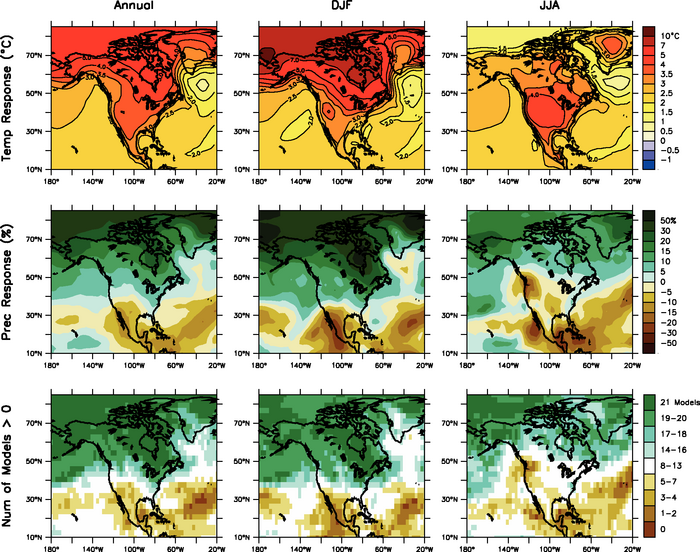
Figure 11.12. Temperature and precipitation changes over North America from the MMD-A1B simulations. Top row: Annual mean, DJF and JJA temperature change between 1980 to 1999 and 2080 to 2099, averaged over 21 models. Middle row: same as top, but for fractional change in precipitation. Bottom row: number of models out of 21 that project increases in precipitation.