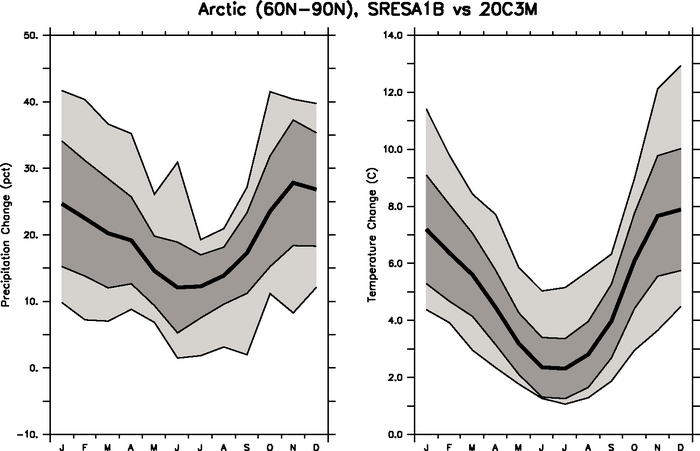
Figure 11.19. Annual cycle of arctic area mean temperature and percentage precipitation changes (averaged over the area north of 60°N) for 2080 to 2099 minus 1980 to 1999, under the A1B scenario. Thick lines represent the ensemble median of the 21 MMD models. The dark grey area represents the 25 and 75% quartile values among the 21 models, while the light grey area shows the total range of the models.