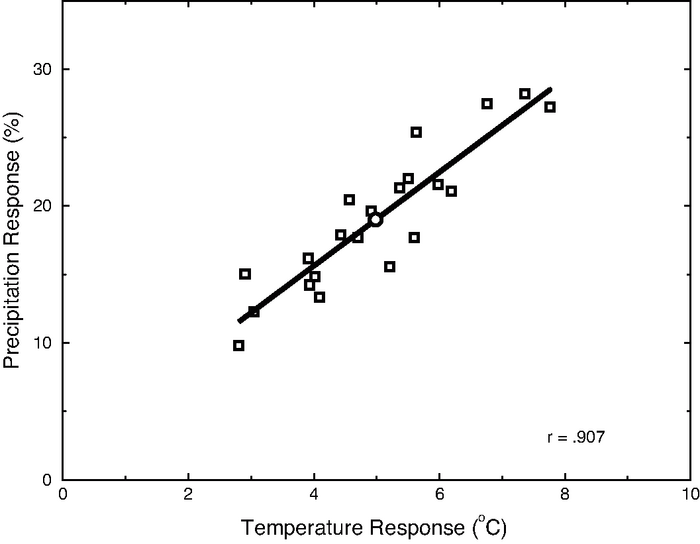
Figure 11.20. Relationship between the change in annual precipitation (%) and temperature (°C) (2080–2099 minus 1980–1999) in the Arctic (averaged over the area north of 60°N) in the MMD-A1B projections. Each point represents one model. The model ensemble mean response is indicated by the circle.