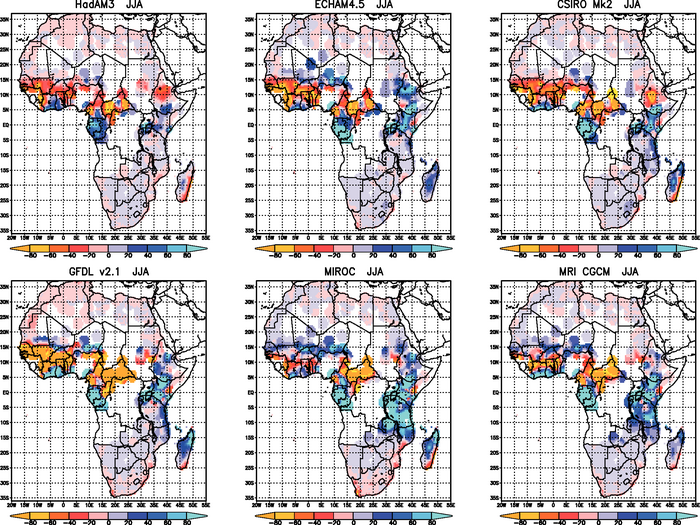
Figure 11.3. Anomaly of mean monthly precipitation (mm) using daily data empirically downscaled from six GCMs (ECHAM4.5, Hadley Centre Atmospheric Model (HadAM3), CSIRO Mk2, GFDL 2.1, MRI, MIROC; see Table 8.1 for descriptions of most of these models) to 858 station locations. The GCMs were forced by the SRES A2 scenario. Anomalies are for the future period (2070 to 2099 for the first three models, and 2080 to 2099 for the latter three models) minus a control 30-year period (from Hewitson and Crane, 2006).