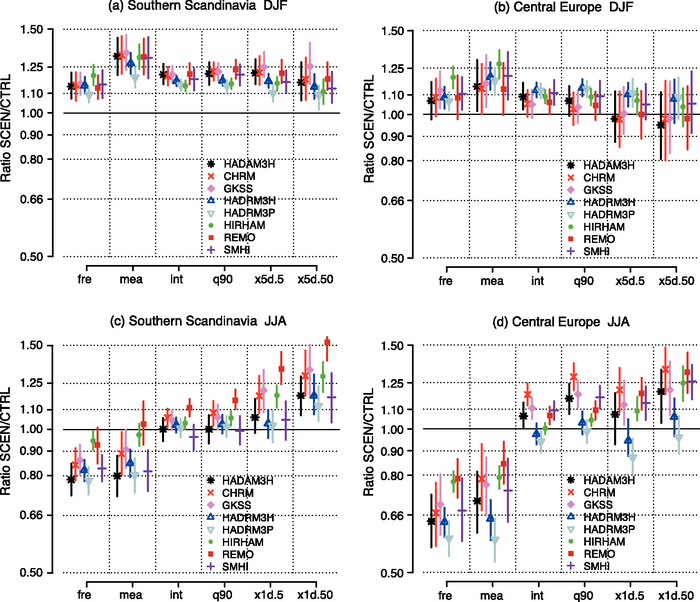
Figure 11.7. Changes (ratio 2071–2100 / 1961–1990 for the A2 scenario) in domain-mean precipitation diagnostics in the PRUDENCE simulations in southern Scandinavia (5°E–20°E, 55°N–62°N) and central Europe (5°E–15°E, 48°N–54°N) in winter (top) and in summer (bottom). fre = wet-day frequency; mea = mean seasonal precipitation; int = mean wet-day precipitation; q90 = 90th percentile of wet-day precipitation; x1d.5 and x1d.50 = 5- and 50-year return values of one-day precipitation; x5d.5 and x5d.50 = 5- and 50-year return values of five-day precipitation. For each of the eight models, the vertical bar gives the 95% confidence interval associated with sampling uncertainty (redrawn from Frei et al., 2006). Models are the Hadley Centre Atmospheric Model (HadAM3H), the Climate High Resolution Model (CHRM), the climate version of the ‘Lokalmodell’ (CLM), the Hadley Centre Regional Model (HadRM3H and HadRM3P), the combination of the High-Resolution Limited Area Model (HIRLAM) and the European Centre Hamburg (ECHAM4) GCM (HIRHAM), the regional climate model REMO, and the Rossby Centre regional Atmosphere-Ocean model (RCAO).