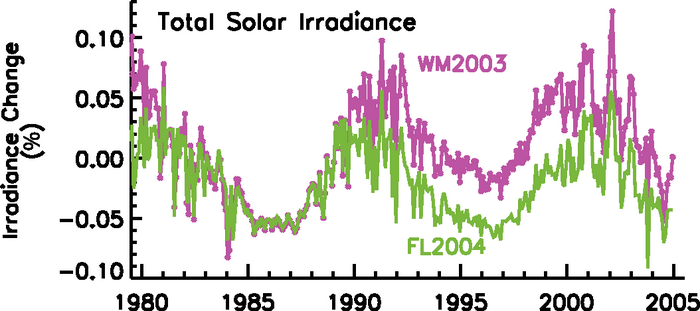
Figure 2.16. Percentage change in monthly values of the total solar irradiance composites of Willson and Mordvinov (2003; WM2003, violet symbols and line) and Fröhlich and Lean (2004; FL2004, green solid line).
Figure 2.16. Percentage change in monthly values of the total solar irradiance composites of Willson and Mordvinov (2003; WM2003, violet symbols and line) and Fröhlich and Lean (2004; FL2004, green solid line).