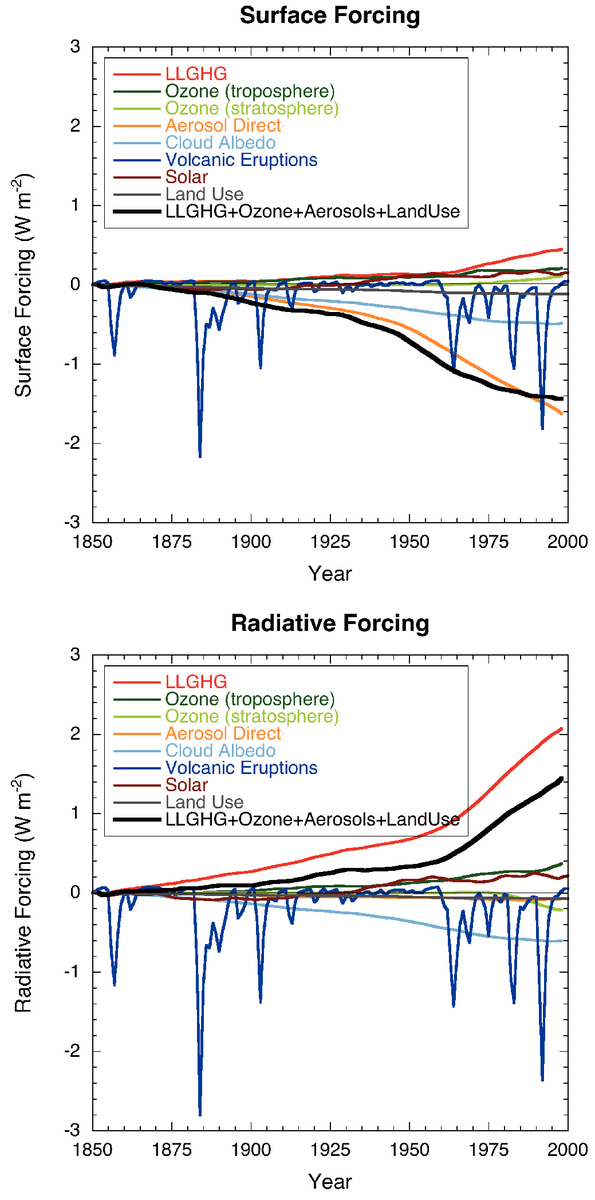
Figure 2.23. Globally and annually averaged temporal evolution of the instantaneous all-sky RF (top panel) and surface forcing (bottom panel) due to various agents, as simulated in the MIROC+SPRINTARS model (Nozawa et al., 2005; Takemura et al., 2005). This is an illustrative example of the forcings as implemented and computed in one of the climate models participating in the AR4. Note that there could be differences in the RFs among models. Most models simulate roughly similar evolution of the LLGHGs’ RF.