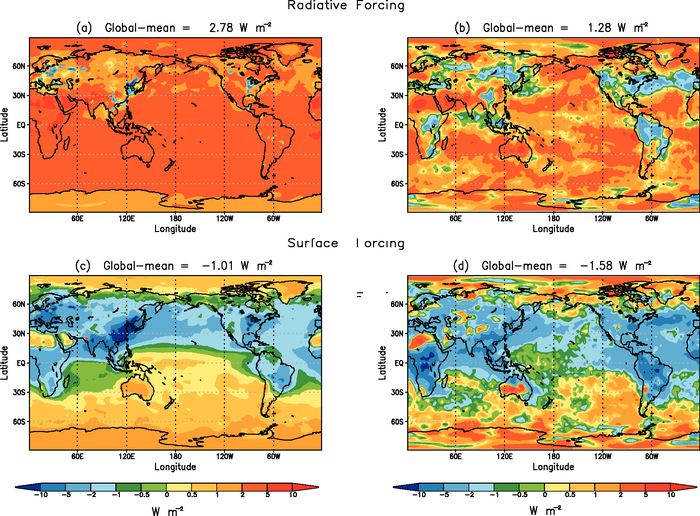
Figure 2.24. Instantaneous change in the spatial distribution of the net (solar plus longwave) radiative flux (W m–2) due to natural plus anthropogenic forcings between the years 1860 and 2000. Results here are intended to be illustrative examples of these quantities in two different climate models. (a) and (c) correspond to tropopause and surface results using the GFDL CM 2.1 model (adapted from Knutson et al., 2006). (b) and (d) correspond to tropopause and surface results using the MIROC+SPRINTARS model (adapted from Nozawa et al., 2005 and Takemura et al., 2005). Note that the MIROC+SPRINTARS model takes into account the aerosol cloud albedo effect while the CM 2.1 model does not.