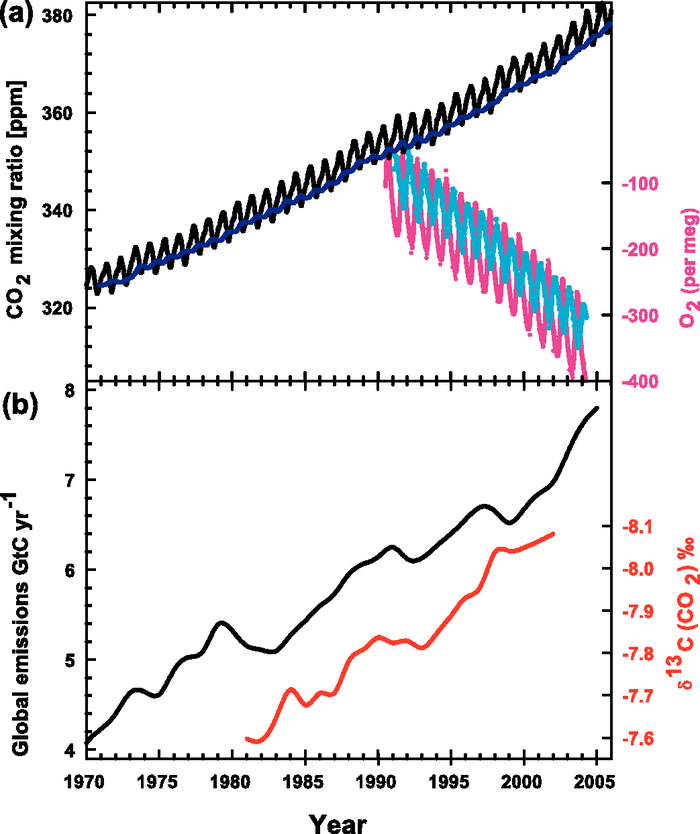
Figure 2.3. Recent CO2 concentrations and emissions. (a) CO2 concentrations (monthly averages) measured by continuous analysers over the period 1970 to 2005 from Mauna Loa, Hawaii (19°N, black; Keeling and Whorf, 2005) and Baring Head, New Zealand (41°S, blue; following techniques by Manning et al., 1997). Due to the larger amount of terrestrial biosphere in the NH, seasonal cycles in CO2 are larger there than in the SH. In the lower right of the panel, atmospheric oxygen (O2) measurements from flask samples are shown from Alert, Canada (82°N, pink) and Cape Grim, Australia (41°S, cyan) (Manning and Keeling, 2006). The O2 concentration is measured as ‘per meg’ deviations in the O2/N2 ratio from an arbitrary reference, analogous to the ‘per mil’ unit typically used in stable isotope work, but where the ratio is multiplied by 106 instead of 103 because much smaller changes are measured. (b) Annual global CO2 emissions from fossil fuel burning and cement manufacture in GtC yr–1 (black) through 2005, using data from the CDIAC website (Marland et al, 2006) to 2003. Emissions data for 2004 and 2005 are extrapolated from CDIAC using data from the BP Statistical Review of World Energy (BP, 2006). Land use emissions are not shown; these are estimated to be between 0.5 and 2.7 GtC yr–1 for the 1990s ( Table 7.2 ). Annual averages of the 13C/12C ratio measured in atmospheric CO2 at Mauna Loa from 1981 to 2002 (red) are also shown (Keeling et al, 2005). The isotope data are expressed as δ13C(CO2) ‰ (per mil) deviation from a calibration standard. Note that this scale is inverted to improve clarity.