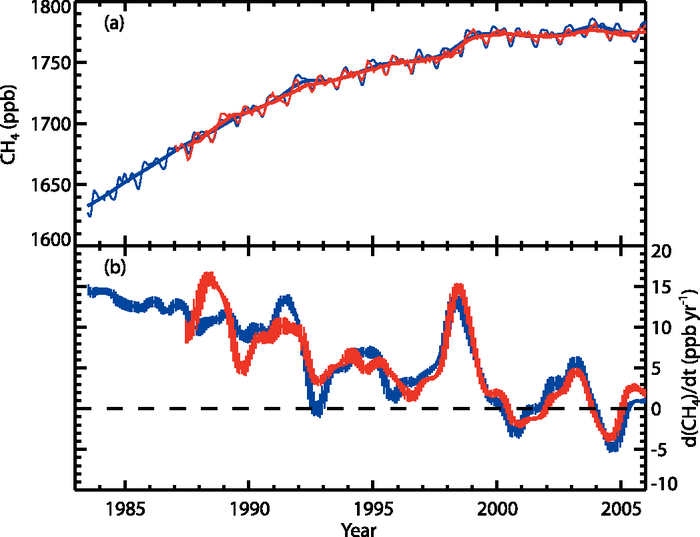
Figure 2.4. Recent CH4 concentrations and trends. (a) Time series of global CH4 abundance mole fraction (in ppb) derived from surface sites operated by NOAA/GMD (blue lines) and AGAGE (red lines). The thinner lines show the CH4 global averages and the thicker lines are the de-seasonalized global average trends from both networks. (b) Annual growth rate (ppb yr–1) in global atmospheric CH4 abundance from 1984 through the end of 2005 (NOAA/GMD, blue), and from 1988 to the end of 2005 (AGAGE, red). To derive the growth rates and their uncertainties for each month, a linear least squares method that takes account of the autocorrelation of residuals is used. This follows the methods of Wang et al. (2002) and is applied to the de-seasonalized global mean mole fractions from (a) for values six months before and after the current month. The vertical lines indicate ±2 standard deviation uncertainties (95% confidence interval), and 1 standard deviation uncertainties are between 0.1 and 1.4 ppb yr–1 for both AGAGE and NOAA/GMD. Note that the differences between AGAGE and NOAA/GMD calibration scales are determined through occasional intercomparisons.