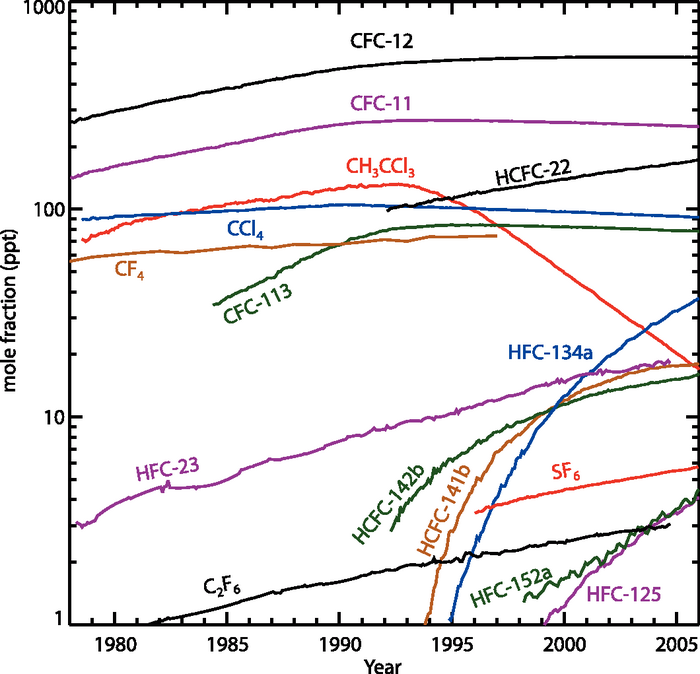
Figure 2.6. Temporal evolution of the global average dry-air mole fractions (ppt) of the major halogen-containing LLGHGs. These are derived mainly using monthly mean measurements from the AGAGE and NOAA/GMD networks. For clarity, the two network values are averaged with equal weight when both are available. While differences exist, these network measurements agree reasonably well with each other (except for CCl4 (differences of 2 – 4% between networks) and HCFC-142b (differences of 3 – 6% between networks)), and with other measurements where available (see text for references for each gas).