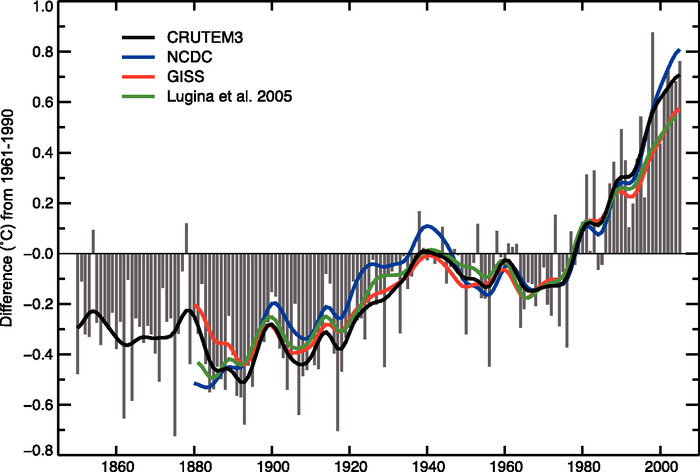
Figure 3.1. Annual anomalies of global land-surface air temperature (°C), 1850 to 2005, relative to the 1961 to 1990 mean for CRUTEM3 updated from Brohan et al. (2006). The smooth curves show decadal variations (see Appendix 3.A ). The black curve from CRUTEM3 is compared with those from NCDC (Smith and Reynolds, 2005; blue), GISS (Hansen et al., 2001; red) and Lugina et al. (2005; green).