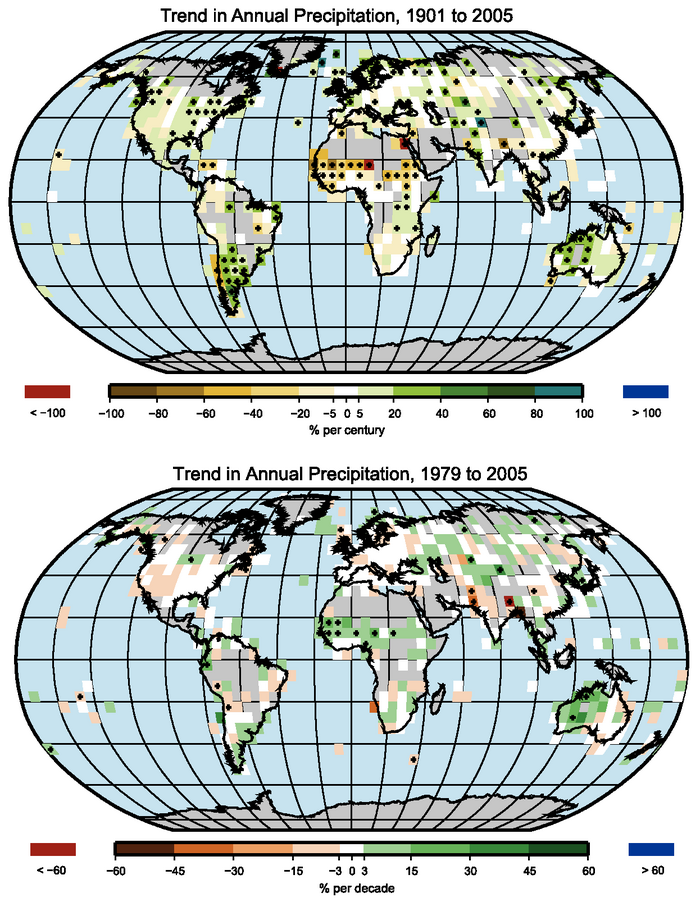
Figure 3.13. Trend of annual land precipitation amounts for 1901 to 2005 (top, % per century) and 1979 to 2005 (bottom, % per decade), using the GHCN precipitation data set from NCDC. The percentage is based on the means for the 1961 to 1990 period. Areas in grey have insufficient data to produce reliable trends. The minimum number of years required to calculate a trend value is 66 for 1901 to 2005 and 18 for 1979 to 2005. An annual value is complete for a given year if all 12 monthly percentage anomaly values are present. Note the different colour bars and units in each plot. Trends significant at the 5% level are indicated by black + marks.