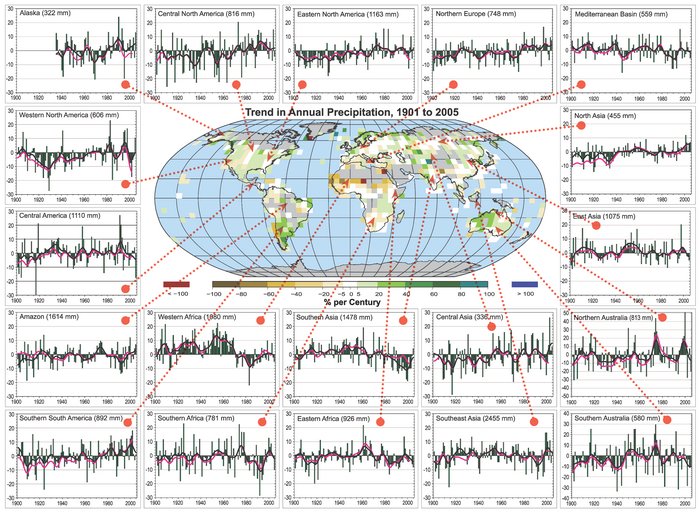
Figure 3.14. Precipitation for 1900 to 2005. The central map shows the annual mean trends (% per century). Areas in grey have insufficient data to produce reliable trends. The surrounding time series of annual precipitation displayed (% of mean, with the mean given at top for 1961 to 1990) are for the named regions as indicated by the red arrows. The GHCN precipitation from NCDC was used for the annual green bars and black for decadal variations (see Appendix 3.A ), and for comparison the CRU decadal variations are in magenta. The range is +30 to –30% except for the two Australian panels. The regions are a subset of those defined in Table 11.1 (Section 11.1) and include: Central North America, Western North America, Alaska, Central America, Eastern North America, Mediterranean, Northern Europe, North Asia, East Asia, Central Asia, Southeast Asia, Southern Asia, Northern Australia, Southern Australia, Eastern Africa, Western Africa, Southern Africa, Southern South America, and the Amazon.