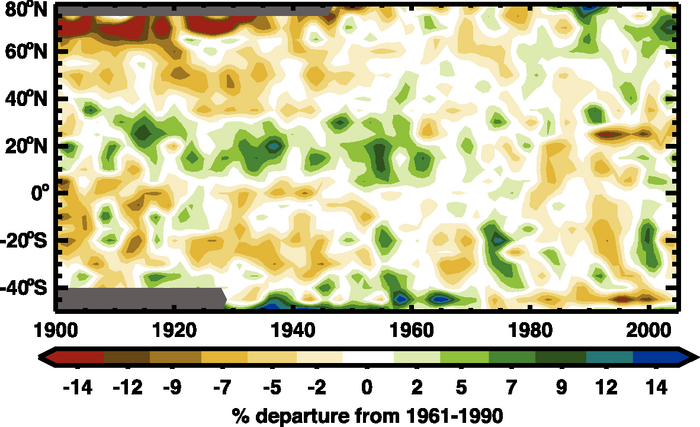
Figure 3.15. Latitude-time section of zonal average annual anomalies for precipitation (%) over land from 1900 to 2005, relative to their 1961 to 1990 means. Values are smoothed with the 5-point filter to remove fluctuations of less than about six years (see Appendix 3.A ). The colour scale is nonlinear and grey areas indicate missing data.