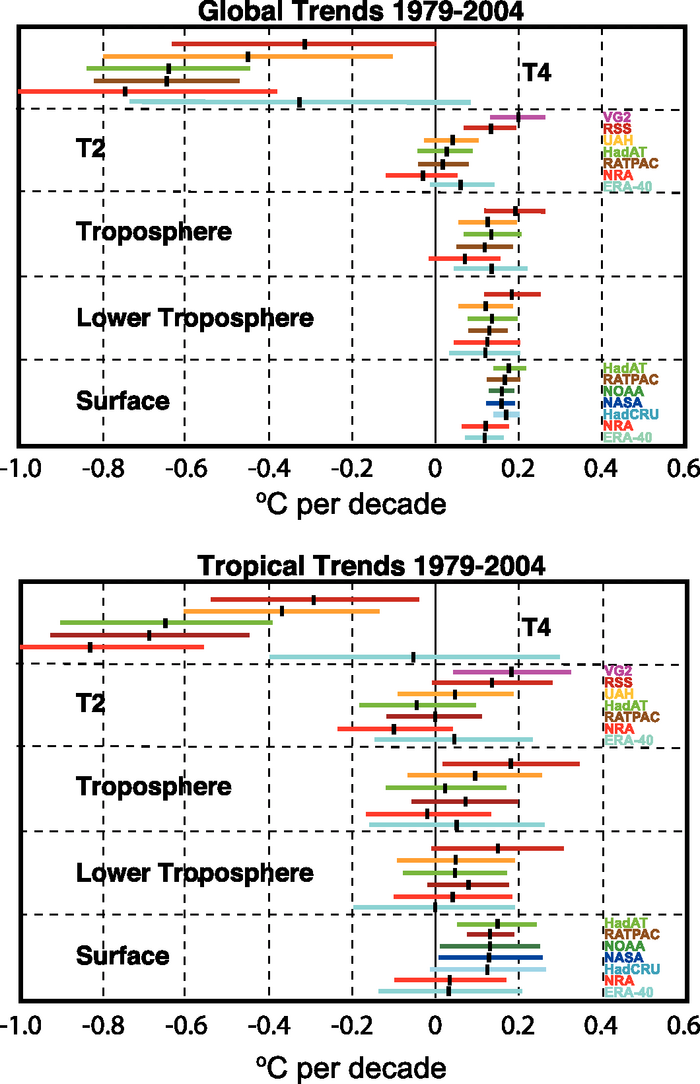
Figure 3.18. Linear temperature trends (°C per decade) for 1979 to 2004 for the globe (top) and tropics (20°N to 20°S; bottom) for the MSU channels T4 (top panel) and T2 (second panel) or equivalent for radiosondes and reanalyses; for the troposphere (third panel) based on T2 with T4 used to statistically remove stratospheric influences (Fu et al., 2004a); for the lower troposphere (fourth panel) based on the UAH retrieval profile; and for the surface (bottom panel). Surface records are from NOAA/NCDC (green), NASA/GISS (blue) and HadCRUT2v (light blue). Satellite records are from UAH (orange), RSS (dark red) and VG2 (magenta); radiosonde-based records are from NOAA RATPAC (brown) and HadAT2 (light green); and atmospheric reanalyses are from NRA (red) and ERA-40 (cyan). The error bars are 5 to 95% confidence limits associated with sampling a finite record with an allowance for autocorrelation. Where the confidence limits exceed –1, the values are truncated. ERA-40 trends are only for 1979 to August 2002. Data from Karl et al. (2006; D. Seidel courtesy of J. Lanzante; and J. Christy).