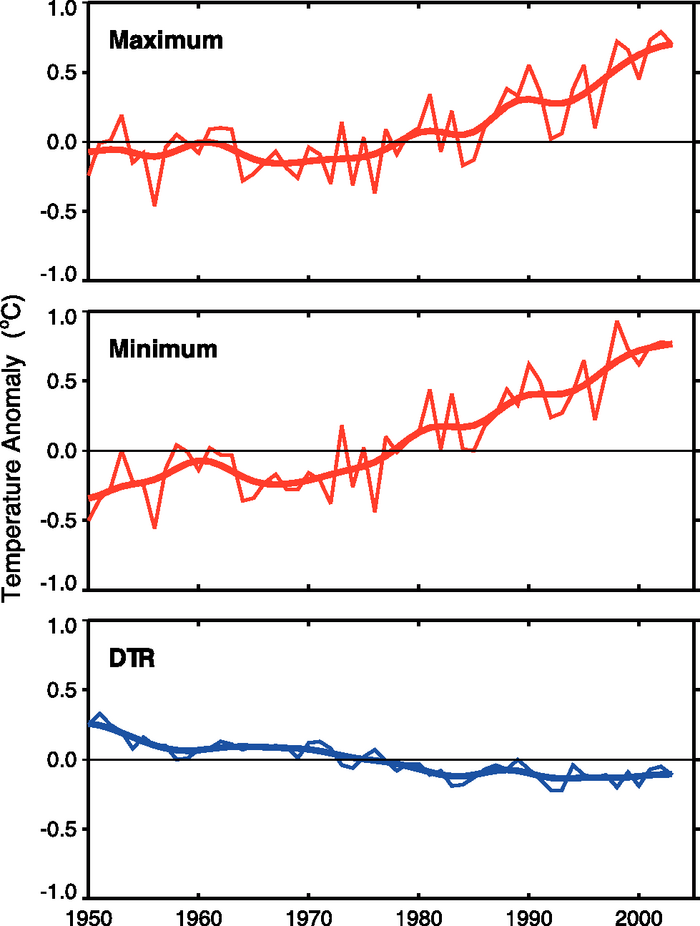
Figure 3.2. Annual anomalies of maximum and minimum temperatures and DTR (°C) relative to the 1961 to 1990 mean, averaged for the 71% of global land areas where data are available for 1950 to 2004. The smooth curves show decadal variations (see Appendix 3.A ). Adapted from Vose et al. (2005a).