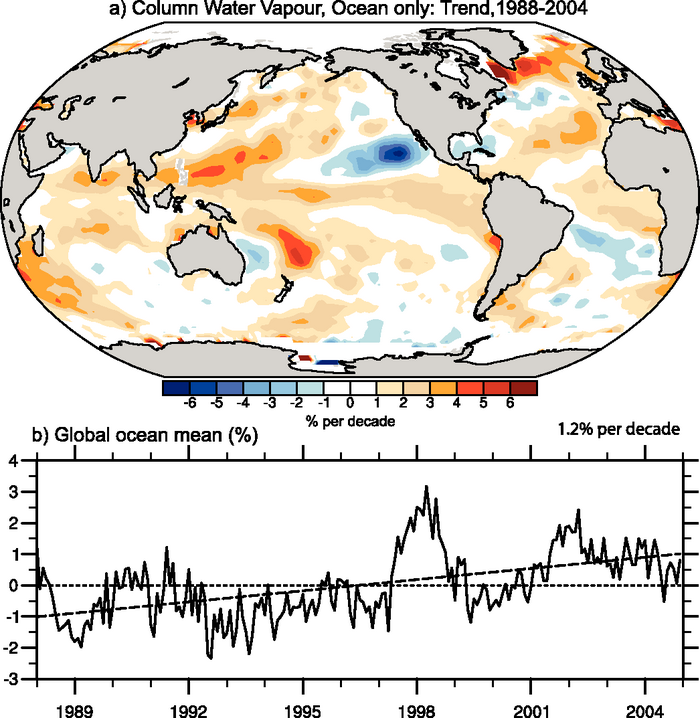
Figure 3.20. Linear trends in precipitable water (total column water vapour) in % per decade (top) and monthly time series of anomalies relative to the 1988 to 2004 period in % over the global ocean plus linear trend (bottom), from RSS SSM/I (updated from Trenberth et al., 2005a).