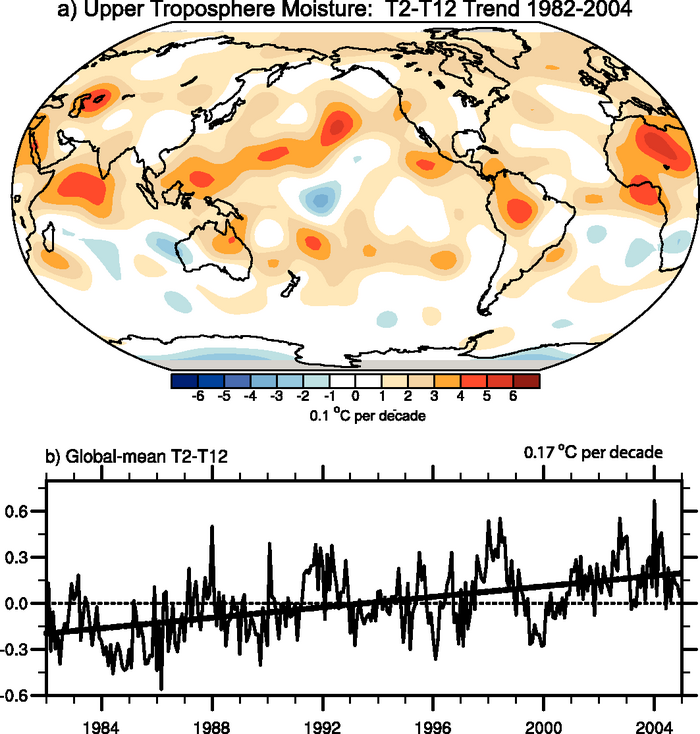
Figure 3.21. The radiative signature of upper-tropospheric moistening is given by upward linear trends in T2−T12 for 1982 to 2004 (0.1 ºC per decade; top) and monthly time series of the global-mean (80°N to 80°S) anomalies relative to 1982 to 2004 (ºC) and linear trend (dashed; bottom). Data are from the RSS T2 and HIRS T12 (Soden et al., 2005). The map is smoothed to spectral truncation T31 resolution.