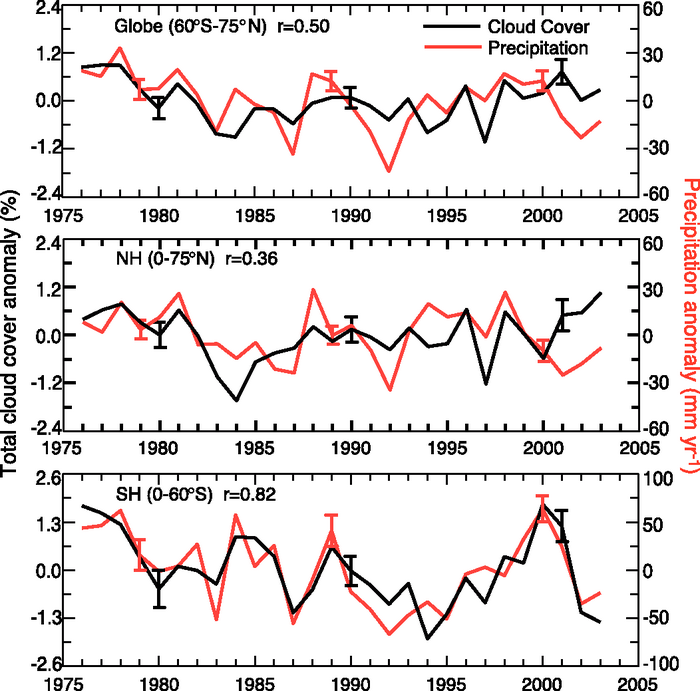
Figure 3.22. Annual total land (excluding the USA and Canada) cloud cover (black) and precipitation (red) anomalies from 1976 to 2003 over global (60°S–75°N), NH and SH regions, with the correlation coefficient (r) shown at the top. The cloud cover is derived by gridding and area-averaging synoptic observations and the precipitation is updated from Chen et al. (2002). Typical 5 to 95% error bars for each decade are estimates using inter-grid-box variations (from Dai et al., 2006).