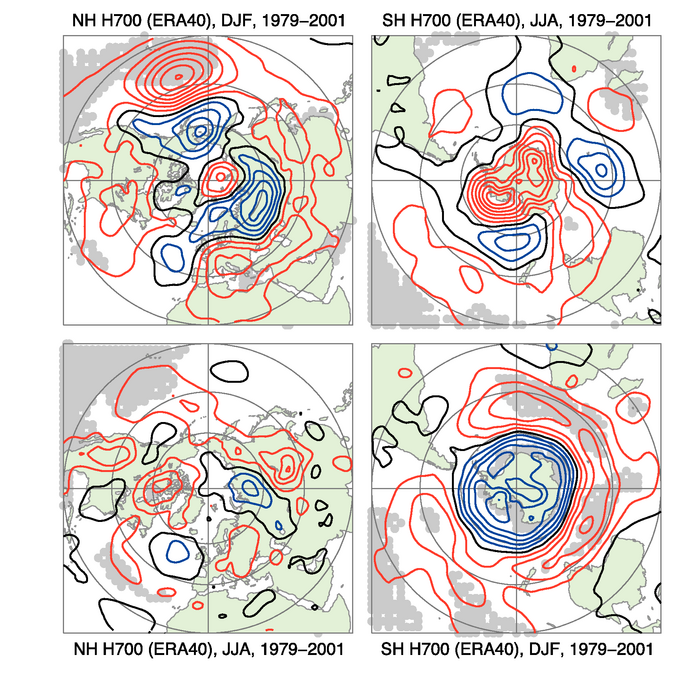
Figure 3.24. Linear trends in ERA-40 700 hPa geopotential height from 1979 to 2001 for DJF (top left and bottom right) and JJA (bottom left and top right), for the NH (left) and SH (right). Trends are contoured in 5 gpm per decade and are calculated from seasonal means of daily 1200 UTC fields. Red contours are positive, blue negative and black zero; the grey background indicates 1% statistical significance using a standard least squares F-test and assuming independence between years.