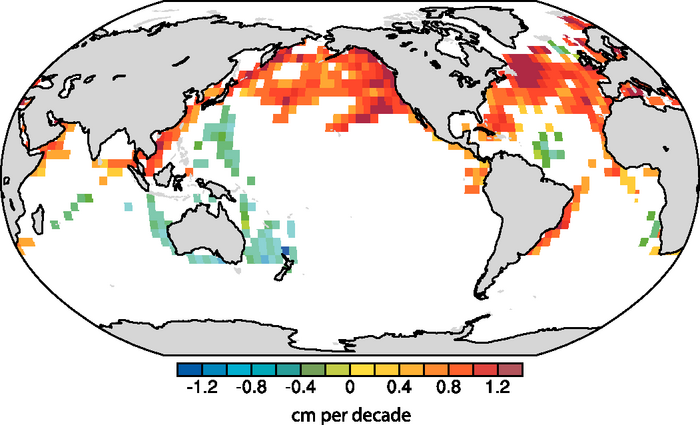
Figure 3.25. Estimates of linear trends in significant wave height (cm per decade) for regions along the major ship routes of the global ocean for 1950 to 2002. Trends are shown only for locations where they are significant at the 5% level. Adapted from Gulev and Grigorieva (2004).