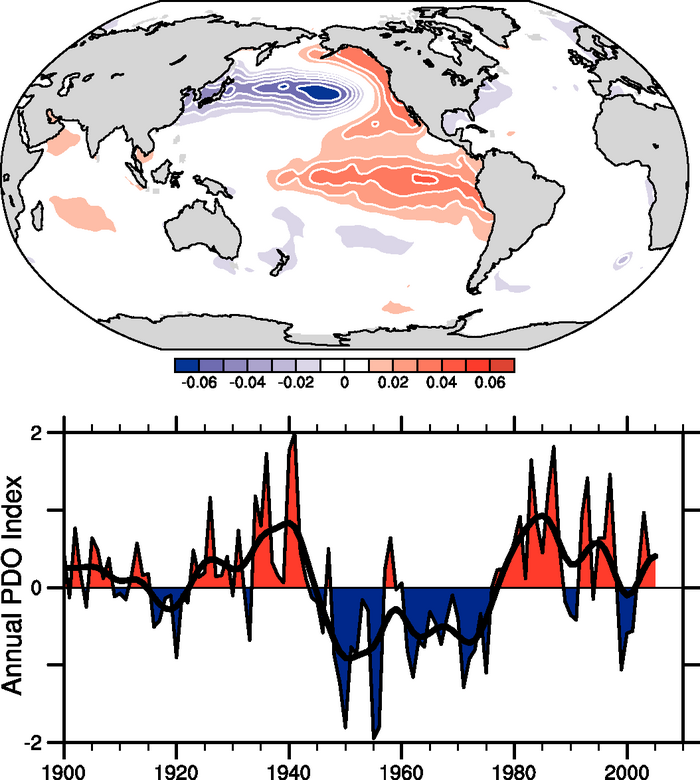
Figure 3.28. Pacific Decadal Oscillation: (top) SST based on the leading EOF SST pattern for the Pacific basin north of 20°N for 1901 to 2004 (updated; see Mantua et al., 1997; Power et al., 1999b) and projected for the global ocean (units are nondimensional); and (bottom) annual time series (updated from Mantua et al., 1997). The smooth black curve shows decadal variations (see Appendix 3.A ).