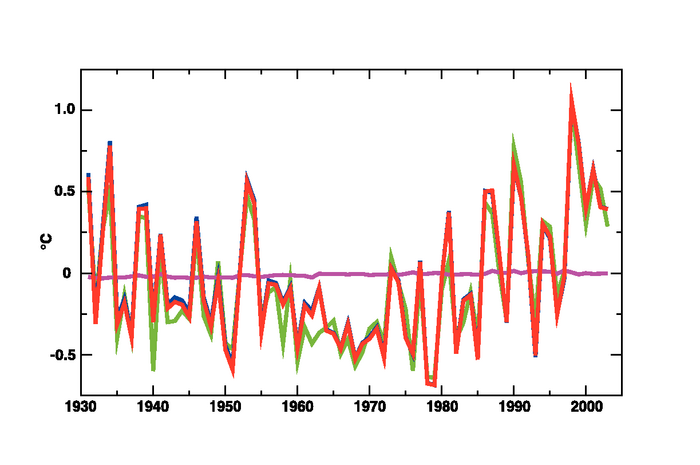
Figure 3.3. Anomaly (°C) time series relative to the 1961 to 1990 mean of the full US Historical Climatology Network (USHCN) data (red), the USHCN data without the 16% of the stations with populations of over 30,000 within 6 km in the year 2000 (blue), and the 16% of the stations with populations over 30,000 (green). The full USHCN set minus the set without the urban stations is shown in magenta. Both the full data set and the data set without the high-population stations had stations in all of the 2.5° latitude by 3.5° longitude grid boxes during the entire period plotted, but the subset of high-population stations only had data in 56% of these grid boxes. Adapted from Peterson and Owen (2005).
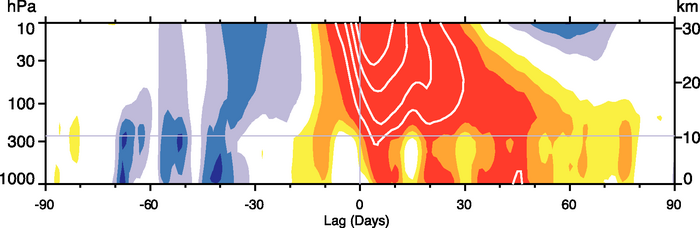
Box 3.3 , Figure 1. Composites of time-height development of the NAM index for 18 weak vortex events. The events are selected by the dates on which the 10 hPa annular mode index crossed –3.0. Day 0 is the start of the weak vortex event. The indices are non-dimensional; the contour interval for the colour shading is 0.25, and 0.5 for the white lines. Values between –0.25 and 0.25 are not shaded. Yellow and red shading indicates negative NAM indices and blue shading indicates positive indices. The thin horizontal lines indicate the approximate boundary between the troposphere and the stratosphere. Modified from Baldwin and Dunkerton (2001).