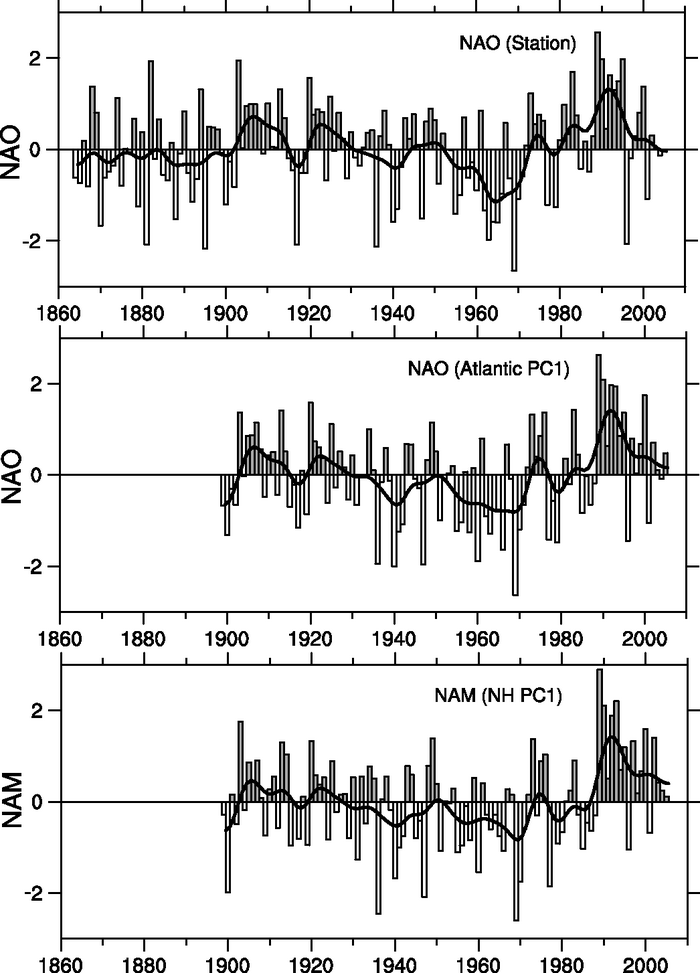
Figure 3.31. Normalised indices (units of standard deviation) of the mean winter (December–March) NAO developed from sea level pressure data. In the top panel, the index is based on the difference of normalised sea level pressure between Lisbon, Portugal and Stykkisholmur/Reykjavik, Iceland from 1864 to 2005. The average winter sea level pressure data at each station were normalised by dividing each seasonal pressure anomaly by the long-term (1864 to 1983) standard deviation. In the middle panel, the index is the principal component time series of the leading EOF of Atlantic-sector sea level pressure. In the lower panel, the index is the principal component time series of the leading EOF of NH sea level pressure. The smooth black curves show decadal variations (see Appendix 3.A ). The individual bar corresponds to the January of the winter season (e.g., 1990 is the winter of 1989/1990). Updated from Hurrell et al. (2003); see http://www.cgd.ucar.edu/cas/jhurrell/indices.html for updated time series.