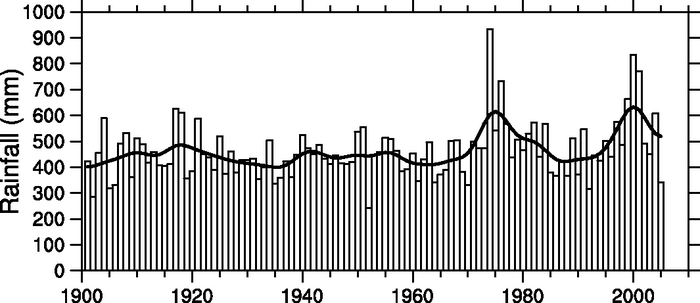
Figure 3.36. Time series of northern Australian (north of 26°S) wet season (October–April) rainfall (mm) from 1900/1901 to 2004/2005. The individual bar corresponds to the January of the summer season (e.g., 1990 is the summer of 1989/1990). The smooth black curve shows decadal variations (see Appendix 3.A ). Data from the Australian Bureau of Meteorology.