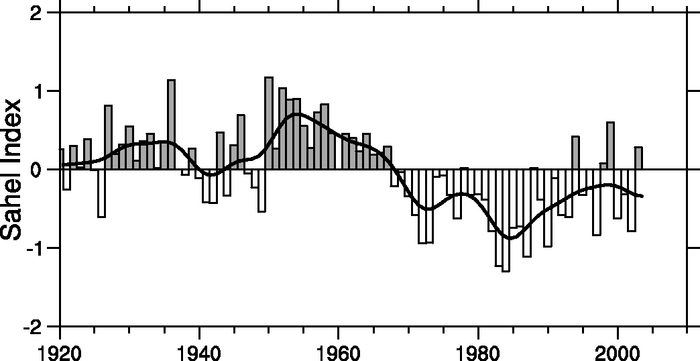
Figure 3.37. Time series of Sahel (10ºN –20ºN, 18ºW–20ºE) regional rainfall (April–October) from 1920 to 2003 derived from gridding normalised station anomalies and then averaging using area weighting (adapted from Dai et al., 2004a). The smooth black curve shows decadal variations (see Appendix 3.A ).