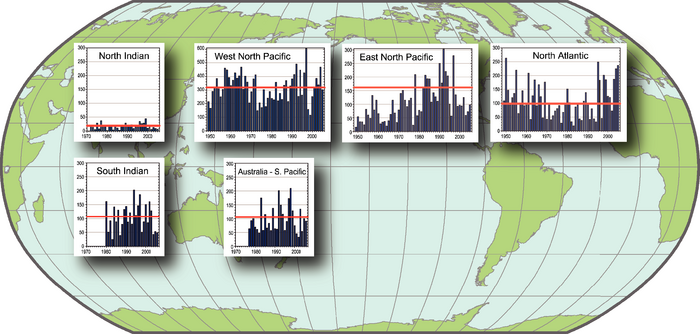
Figure 3.40. Seasonal values of the ACE index for the North Indian, South Indian, West North Pacific, East North Pacific, North Atlantic and combined Australian-South Pacific regions. The vertical scale in the West North Pacific is twice as large as that of other basins. The SH values are those for the season from July the year before to June of the year plotted. The timeline runs from 1948 or 1970 through 2005 in the NH and through June 2006 in the SH. The ACE index accounts for the combined strength and duration of tropical storms and hurricanes during a given season by computing the sum of squares of the six-hour maximum sustained surface winds in knots while the storm is above tropical storm intensity. Adapted and updated from Levinson (2005).