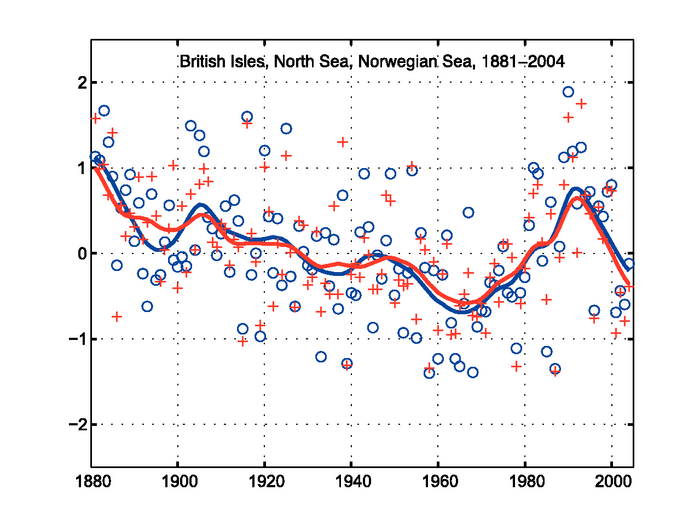
Figure 3.41. Storm index for the British Isles, North Sea and Norwegian Sea, 1881 to 2004. Blue circles are 95th percentiles and red crosses 99th percentiles of standardised geostrophic winds averaged over 10 sets of triangles of stations. The smoothed curves are a decadal filter (updated from Alexandersson et al., 2000).