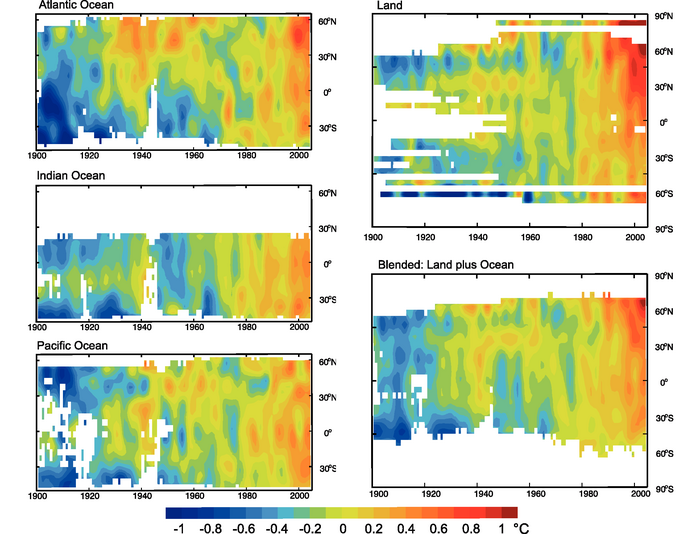
Figure 3.5. Latitude-time sections of zonal mean temperature anomalies (°C) from 1900 to 2005, relative to the 1961 to 1990 mean. Left panels: SST annual anomalies across each ocean from HadSST2 (Rayner et al., 2006). Right panels: Surface temperature annual anomalies for land (top, CRUTEM3) and land plus ocean (bottom, HadCRUT3). Values are smoothed with the 5-point filter to remove fluctuations of less than about six years (see Appendix 3.A ); and white areas indicate missing data.