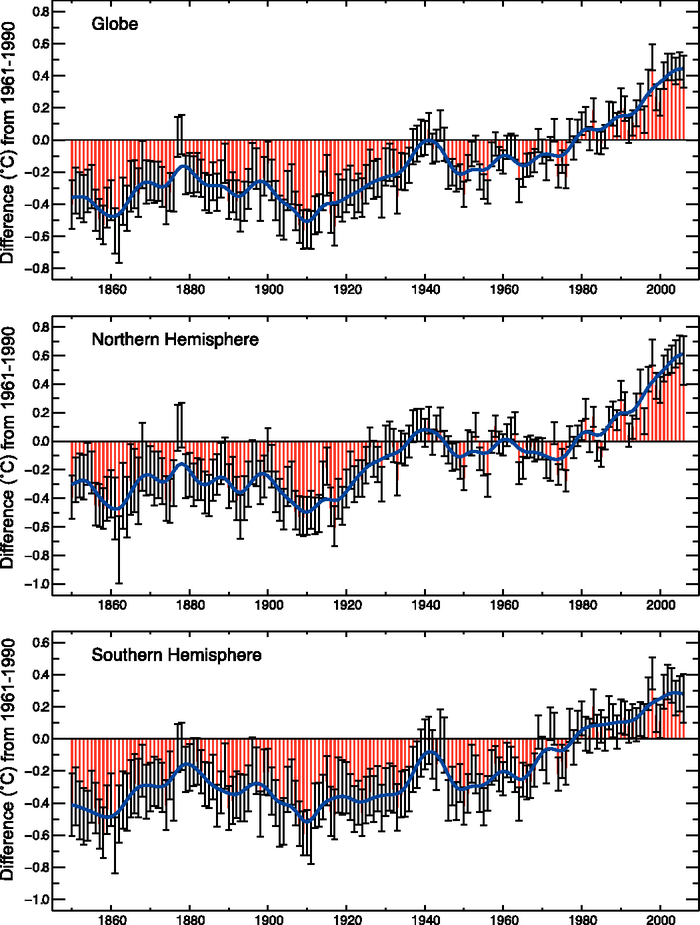
Figure 3.6. Global and hemispheric annual combined land-surface air temperature and SST anomalies (°C) (red) for 1850 to 2006 relative to the 1961 to 1990 mean, along with 5 to 95% error bar ranges, from HadCRUT3 (adapted from Brohan et al., 2006). The smooth blue curves show decadal variations (see Appendix 3.A ).