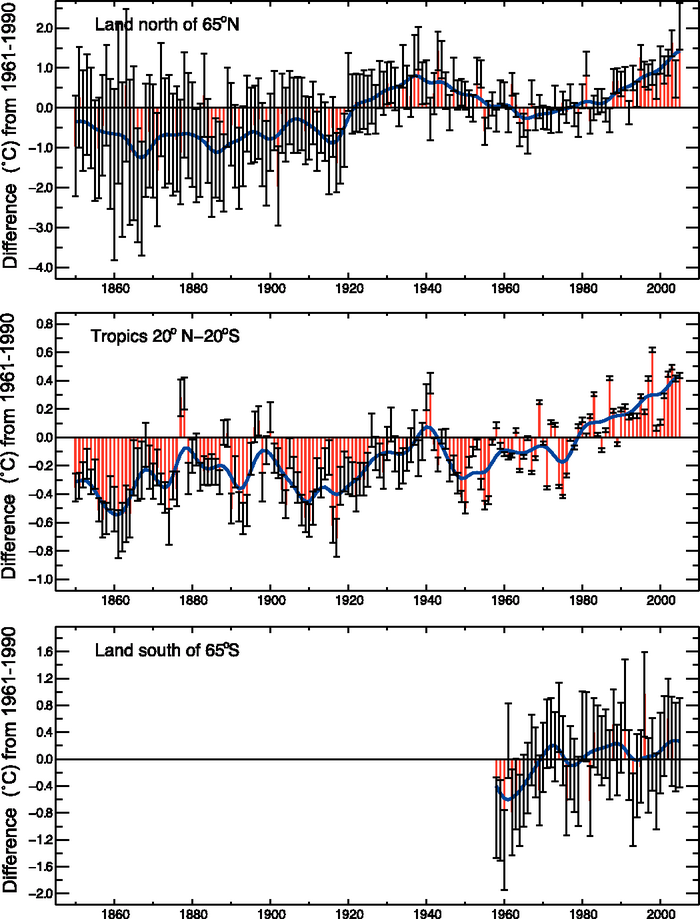
Figure 3.7. Annual temperature anomalies (°C) up to 2005, relative to the 1961 to 1990 mean (red) with 5 to 95% error bars. The tropical series (middle) is combined land-surface air temperature and SST from HADCRUT3 (adapted from Brohan et al., 2006). The polar series (top and bottom) are land-only from CRUTEM3, because SST data are sparse and unreliable in sea ice zones. The smooth blue curves show decadal variations (see Appendix 3.A ).