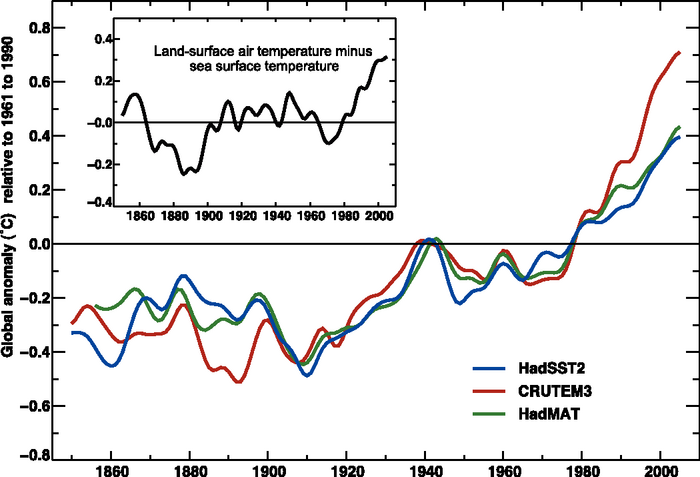
Figure 3.8. Annual anomalies (°C) of global average SST (blue curve, begins 1850), NMAT (green curve, begins 1856) and land-surface air temperature (red curve, begins 1850) to 2005, relative to their 1961 to 1990 means (Brohan et al., 2006; Rayner et al., 2006). The smooth curves show decadal variations (see Appendix 3.A ). Inset shows the smoothed differences between the land-surface air temperature and SST anomalies (i.e., red minus blue).