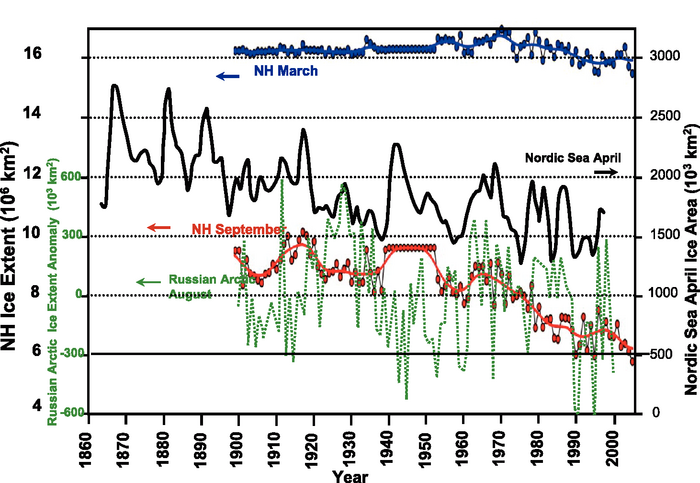
Figure 4.10. Time series of NH sea ice extent for March and September from the Hadley Centre Sea Ice and Sea Surface Temperature (HadISST) data set (the blue and red curves, updated from Rayner et al., 2003), the April Nordic Sea ice extent (the black curve, redrafted from Vinje, 2001) and the August ice extent anomaly (computed relative to the mean of the entire period) in the Russian Arctic seas – Kara, Laptev, East Siberian and Chukchi (dotted green curve, redrafted from Polyakov et al., 2003). For the NH time series, the symbols indicate yearly values while the curves show the decadal variation (see Appendix 3.A ).